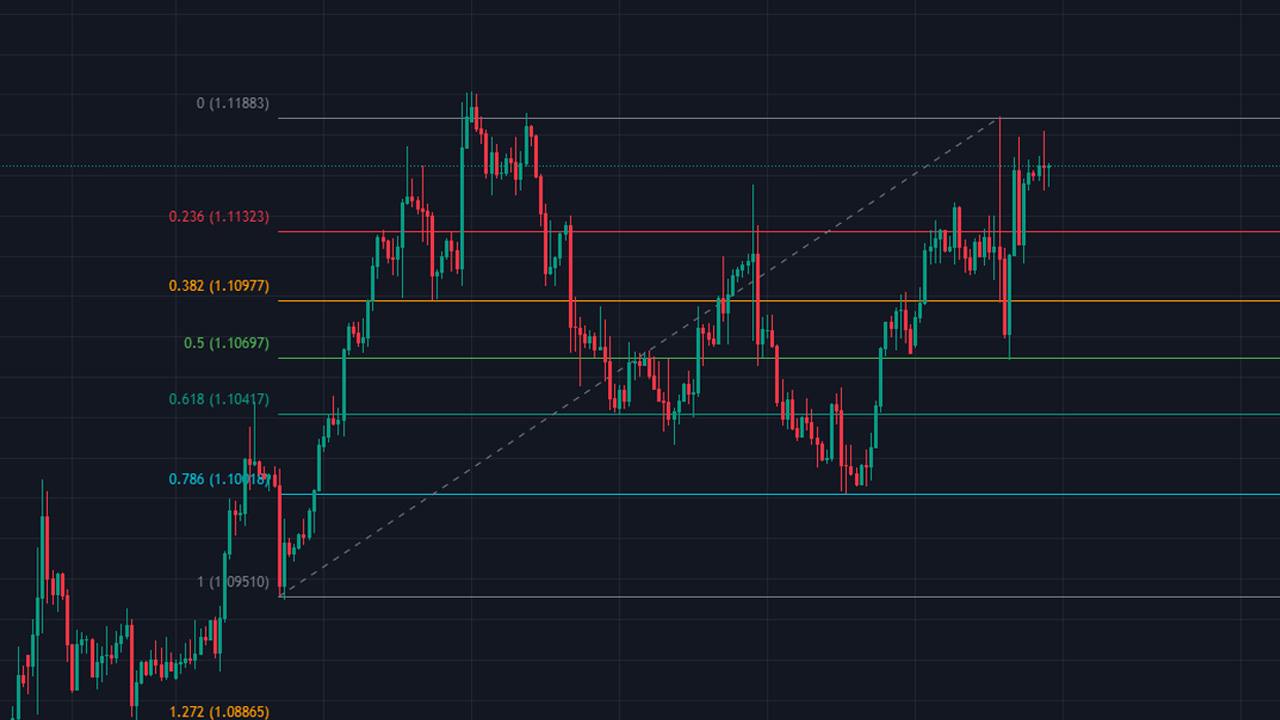
Learn how Fibonacci Retracement pinpoints critical support and resistance levels in Forex trading to fine-tune your entries, exits, and overall risk management approach.
Fibonacci Retracement in Forex Trading
Fibonacci Retracement is a technical analysis tool used to map potential support and resistance areas during a correction. Traders apply the tool between a significant swing low and swing high, then monitor the resulting percentage levels as price retraces part of the original move.
The standard levels commonly displayed on trading platforms are 23.6%, 38.2%, 50%, 61.8%, and 78.6%. These levels organize the depth of a pullback. They do not predict an exact turning point, and price does not need to react at every level.
Fibonacci Retracement works best as a price-mapping framework. Trend direction, support and resistance, momentum, and market structure determine how each retracement level is interpreted.
The Logic Behind Fibonacci Retracement
The Fibonacci Sequence
The Fibonacci sequence begins 0, 1, 1, 2, 3, 5, 8, 13, 21, 34, 55, and continues by adding the previous two numbers together.
Ratios derived from this sequence form the mathematical basis for several levels used in Fibonacci analysis. The most important ratio is approximately 61.8%, commonly called the golden ratio.
How the Main Ratios Are Derived
The 61.8% ratio appears when a Fibonacci number is divided by the number immediately following it as the sequence progresses.
The 38.2% ratio comes from dividing a Fibonacci number by the number two places ahead, while 23.6% comes from comparing it with the number three places ahead.
The 78.6% level is derived from the square root of 61.8%.
The 50% level is not a Fibonacci ratio. Traders include it because markets commonly retrace around half of a preceding move, making it a widely followed technical reference.
The Main Fibonacci Retracement Levels
23.6% Retracement
The 23.6% level represents a shallow correction.
A market holding around this area has given back a relatively small portion of the previous move. Shallow retracements commonly appear during strong directional trends.
38.2% Retracement
The 38.2% level represents a moderate correction and is one of the most closely watched Fibonacci levels.
Traders use this area to assess whether the original trend retains strength after a meaningful pullback.
50% Retracement
The 50% level marks the midpoint of the measured price move.
Although it is not derived directly from the Fibonacci sequence, it is routinely included in Fibonacci tools because the midpoint is a widely followed reference in technical analysis.
61.8% Retracement
The 61.8% level is the principal Fibonacci ratio used in retracement analysis.
It represents a deeper correction while still leaving part of the original price move intact. Traders often study this area closely for evidence that the broader trend is resuming or losing structure.
78.6% Retracement
The 78.6% level represents a deep retracement.
Price reaching this area has returned most of the original move. The setup requires careful attention to the original swing point because a complete break beyond that swing changes the technical structure being measured.
Drawing Fibonacci Retracement Correctly
Start With a Clear Price Swing
Fibonacci Retracement requires two meaningful anchor points: a swing low and a swing high.
The measured move should be visually clear and relevant to the trend being analyzed. Using insignificant fluctuations produces levels with little connection to the broader market structure.
Drawing Fibonacci in an Uptrend
During an uptrend, the Fibonacci Retracement tool is drawn from the significant swing low to the swing high.
The retracement levels then appear below the high. Traders monitor these areas as potential support during a correction.
Drawing Fibonacci in a Downtrend
During a downtrend, the tool is drawn from the significant swing high to the swing low.
The retracement levels appear above the low and provide potential resistance areas during a corrective rally.
Keep the Swing Points Consistent
Different anchor points produce different Fibonacci levels.
Consistent analysis therefore starts with a clear rule for selecting significant swings. Major highs and lows, trend impulses, breakout moves, and clearly defined directional legs provide useful reference points.
Reading Retracement Depth
Shallow Pullbacks
A retracement around 23.6% shows that price has surrendered only a small portion of the previous move.
This type of correction aligns with strong trend conditions where buyers or sellers quickly regain control.
Moderate Pullbacks
The 38.2% and 50% areas represent more substantial corrections.
These levels provide room for price to retrace while keeping the wider directional move clearly visible.
Deep Pullbacks
The 61.8% and 78.6% levels represent deep corrections.
A deep retracement requires greater attention to the original swing structure because price is approaching the starting area of the measured move.
Trading With Fibonacci Retracement
Trend Continuation Setups
The most common Fibonacci strategy focuses on trend continuation.
During an uptrend, traders monitor a retracement into a Fibonacci support area and then look for bullish price structure to return.
During a downtrend, traders monitor a corrective rally into a Fibonacci resistance area and look for bearish structure to resume.
The Fibonacci level identifies the area of interest. Price action confirms the trade setup.
Fibonacci Support and Resistance
Fibonacci levels are treated as zones rather than exact barriers.
Price regularly trades slightly above or below a retracement percentage before establishing direction. This makes surrounding swing structure more important than expecting a reaction at one precise number.
Using Fibonacci for Entry Planning
A trader first identifies the prevailing trend and measures the latest significant directional move.
The retracement levels then provide areas to monitor. An entry is based on confirmation such as rejection from support or resistance, a change in swing structure, a candlestick setup, or renewed momentum.
Using Fibonacci for Stop Placement
Fibonacci levels do not automatically determine the correct stop-loss position.
The stop belongs beyond the price structure that invalidates the trade. Swing highs, swing lows, established support or resistance, and volatility provide stronger references for risk management.
Combining Fibonacci With Other Technical Tools
Fibonacci Retracement and RSI
The Relative Strength Index (RSI) provides momentum information that complements Fibonacci price levels.
Consider an uptrend correcting toward the 61.8% retracement while RSI shows weakening downside momentum. The Fibonacci level identifies the price area, while RSI provides information about the strength of the correction.
Price confirmation remains the final part of the setup.
Fibonacci Retracement and Moving Averages
Moving Averages provide dynamic trend references that can overlap with Fibonacci levels.
A rising Moving Average located near a Fibonacci retracement creates technical confluence during an uptrend. A declining Moving Average near a retracement level creates the equivalent setup during a downtrend.
Two independent tools pointing toward the same price area make that zone more relevant for analysis.
Fibonacci Retracement and Trendlines
Trendlines add another structural reference.
A Fibonacci level intersecting with an established trendline creates a confluence zone. Traders then focus on the actual price response around that area.
Fibonacci Retracement and Horizontal Levels
Previous highs, previous lows, support, and resistance often provide stronger context than a standalone Fibonacci percentage.
A 50% or 61.8% retracement overlapping with an established support or resistance zone creates a clearer technical area than either reference alone.
Fibonacci Retracement Example on EUR/USD
Measuring the Price Move
Consider EUR/USD rising from a swing low of 1.1000 to a swing high of 1.2000.
The total move equals 1,000 pips. Drawing Fibonacci Retracement from 1.1000 to 1.2000 produces the following reference levels:
- 23.6%: 1.1764
- 38.2%: 1.1618
- 50%: 1.1500
- 61.8%: 1.1382
- 78.6%: 1.1214
Reading the Pullback
EUR/USD then begins correcting from 1.2000 toward the 38.2% retracement at 1.1618.
The trader does not enter simply because price reaches 1.1618. Attention shifts to the market reaction around that area.
Bullish rejection, a higher low, strengthening momentum, or support from another technical reference creates evidence that the correction is ending.
Planning the Trade
A confirmed bullish reaction around the retracement provides the basis for a trend-continuation setup.
The entry is based on the confirmed price structure. The stop is placed beyond the technical level that invalidates the setup. The previous swing high at 1.2000 provides one logical area for evaluating the first upside objective.
This process keeps Fibonacci in its correct role: identifying a price area rather than generating the entire trade automatically.
Fibonacci Retracement and Fibonacci Extensions
Retracement Levels Measure Pullbacks
Fibonacci Retracement measures how much of an existing move price has given back.
The levels between 0% and 100% are used to study corrections inside the measured price swing.
Extensions Project Beyond the Swing
Fibonacci Extensions project price levels beyond the measured high or low.
Common extension levels include 127.2%, 161.8%, and 261.8%. Traders use these levels as reference areas for potential objectives after price resumes the broader trend.
Retracements therefore focus on pullbacks, while extensions focus on projections beyond the original swing.
Advanced Fibonacci Techniques
Fibonacci Confluence
Fibonacci confluence occurs when multiple technical references overlap around the same price area.
A 61.8% retracement lining up with horizontal support and a rising Moving Average provides three separate reasons to monitor the same zone.
Multiple Fibonacci Measurements
Traders can measure different significant price swings on the same chart.
Overlapping Fibonacci levels from separate swings create areas of confluence. This technique works best when each measurement is based on a meaningful and clearly defined market swing.
Fibonacci and Price Patterns
Chart patterns can also develop around Fibonacci levels.
A Double Bottom near a retracement level, a bullish rejection around trendline support, or a breakout from consolidation adds price-based confirmation to the Fibonacci analysis.
Strengths of Fibonacci Retracement
Clear Price Mapping
Fibonacci Retracement divides a price swing into standardized percentages, giving traders a structured way to evaluate correction depth.
Useful for Confluence Analysis
Fibonacci levels combine naturally with support and resistance, Moving Averages, trendlines, RSI, and chart patterns.
Works Across Different Timeframes
The tool can be applied to intraday, daily, weekly, and longer-term price swings. The same percentages remain unchanged while the size and duration of the measured move change.
Provides a Consistent Framework
Using the same levels and swing-selection rules creates a repeatable process for analyzing pullbacks across different markets.
Limitations of Fibonacci Retracement
Swing Selection Changes the Levels
Different swing highs and lows produce different retracement prices.
This makes disciplined anchor-point selection an important part of the method.
Fibonacci Levels Are Not Guaranteed Barriers
Price can pass directly through a Fibonacci level without reacting.
The levels identify areas for analysis rather than fixed points where price must reverse.
The Tool Does Not Provide Direction
A retracement percentage alone does not establish a bullish or bearish trade.
Trend structure and price confirmation determine direction.
Fundamental Events Can Override Technical Structure
Interest-rate decisions, inflation releases, employment data, geopolitical developments, and other market-moving events can rapidly change price behavior.
Fibonacci levels remain chart references rather than protection against new fundamental information.
Risk Management With Fibonacci Retracement
Define Invalidation Before Entry
Every Fibonacci setup requires a price level that invalidates the trade thesis.
This level comes from market structure rather than from choosing the next Fibonacci percentage mechanically.
Calculate Position Size From the Stop
Once the entry and stop are defined, the distance between them determines the risk per unit of the position.
Position size is then adjusted to keep the total monetary loss within the trader's predefined risk limit.
Evaluate Risk-to-Reward Before Entry
The distance to the stop should be compared with the realistic target available from the setup.
A Fibonacci level creates an analytical opportunity only when the complete trade structure provides acceptable risk relative to the available reward.
Common Fibonacci Retracement Mistakes
Using 76.4% as the Standard Deep Retracement
The commonly used deep Fibonacci retracement level on modern charting platforms is 78.6%.
The level is derived from the square root of 61.8% and sits between the 61.8% retracement and a complete 100% return to the original swing point.
Treating 50% as a Fibonacci Ratio
The 50% retracement is widely used in Fibonacci analysis, though it is not derived from the Fibonacci sequence.
It remains useful as the midpoint of the measured market move.
Entering at Every Fibonacci Level
A retracement percentage identifies an area to monitor. It does not create an automatic trade.
Entries require evidence from price structure, momentum, or another independent technical reference.
Placing Stops Directly Behind the Next Fibonacci Level
Stop placement should reflect trade invalidation rather than the nearest percentage printed on the chart.
Measuring Random Price Swings
Fibonacci analysis becomes inconsistent when the anchor points change without a clear reason.
Significant swing highs and lows provide a stronger basis for repeatable analysis.
Conclusion on Fibonacci Retracement
Using Fibonacci Levels in a Structured Trading Approach
Fibonacci Retracement measures the depth of a correction within a defined price move. The principal levels used by traders are 23.6%, 38.2%, 50%, 61.8%, and 78.6%, with 50% included as a widely followed midpoint rather than a true Fibonacci ratio.
The tool is most useful for identifying areas where traders can study price behavior during a pullback. It does not determine direction or guarantee support and resistance.
A structured Fibonacci approach starts with clear swing points, evaluates the wider trend, looks for technical confluence, waits for price confirmation, and defines risk from market structure. This keeps the tool focused on what it does well: organizing retracements into clear and repeatable price zones.
FAQs
What Is Fibonacci Retracement?
Fibonacci Retracement is a technical analysis tool that divides a measured price move into percentage levels used to identify potential support and resistance areas during a correction.
What Are the Main Fibonacci Retracement Levels?
The commonly used levels are 23.6%, 38.2%, 50%, 61.8%, and 78.6%. The 50% level is widely included despite not being a Fibonacci ratio.
Is 76.4% or 78.6% the Standard Fibonacci Retracement?
The standard deep retracement level commonly used on modern Fibonacci tools is 78.6%. It is derived from the square root of the 61.8% ratio.
How Is Fibonacci Retracement Drawn in an Uptrend?
In an uptrend, the tool is drawn from the significant swing low to the swing high. The retracement levels then provide reference areas below the high.
How Is Fibonacci Retracement Drawn in a Downtrend?
In a downtrend, the tool is drawn from the significant swing high to the swing low. The resulting levels provide reference areas above the low.
Does Fibonacci Retracement Predict Reversals?
Fibonacci Retracement identifies price areas where traders watch for a reaction. The actual reversal signal comes from price structure and confirmation around the level.
Can Fibonacci Retracement Be Combined With RSI?
RSI adds momentum information to Fibonacci price analysis. A retracement level combined with a relevant RSI reading gives traders both price and momentum context.
Can Fibonacci Retracement Be Combined With Moving Averages?
Moving Averages provide dynamic trend references that can overlap with Fibonacci levels. This creates technical confluence around the same price area.
What Is the Difference Between Fibonacci Retracement and Extension?
Fibonacci Retracement measures corrections inside an existing price swing. Fibonacci Extensions project reference levels beyond the original high or low.
Which Fibonacci Retracement Level Is the Strongest?
No single retracement percentage has permanent priority across all markets and setups. The most relevant level is the one supported by current market structure, trend direction, and additional technical confluence.
Published by:
 Daniel Carter