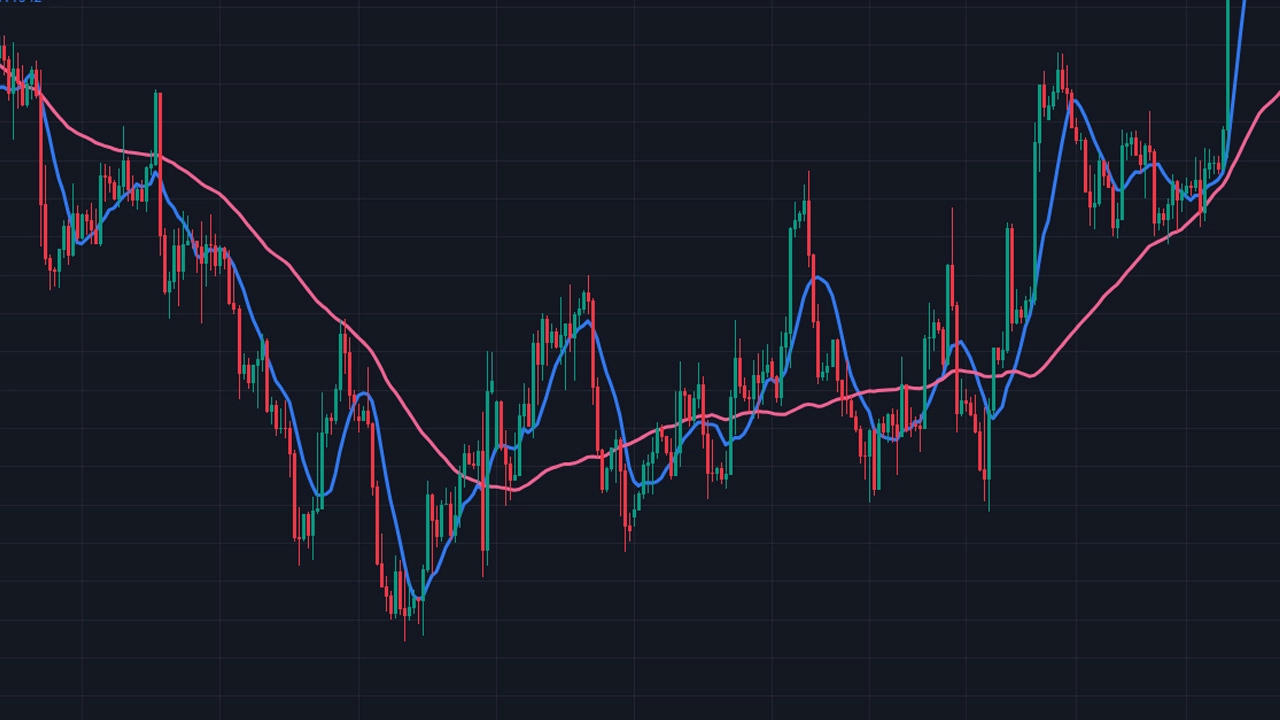
Learn to use the Moving Average indicator in Forex trading to spot trends, pinpoint potential entry and exit points, and strengthen your strategies with this core tool.
Moving Average (MA) in Forex Trading
A Moving Average (MA) is a technical indicator that smooths price data over a selected number of periods. Traders use Moving Averages to study trend direction, momentum, pullbacks, crossovers, and the relationship between current price and its recent average.
Moving Averages are calculated from historical price data, making them lagging indicators. They describe how price has developed rather than predicting the next price movement. Their value comes from organizing price action and making trends easier to read.
The two most widely used forms are the Simple Moving Average (SMA) and Exponential Moving Average (EMA). Both measure average price over a defined period, while the weighting of recent data creates an important difference between them.
Moving Average Basics
What a Moving Average Shows
A Moving Average takes a set number of price observations and converts them into a continuously updated average. Each new candle adds fresh information to the calculation while older data leaves the selected period.
On a daily chart, a 50-period Moving Average represents 50 daily observations. On a one-hour chart, the same 50-period setting represents 50 hourly observations. The number describes chart periods rather than one fixed unit of time.
Traders commonly calculate Moving Averages from closing prices, though trading platforms also support open, high, low, median, and other price inputs.
Simple Moving Average (SMA)
The Simple Moving Average gives equal weight to every price included in the calculation.
A 10-period SMA based on closing prices adds the latest 10 closing prices and divides the total by 10. When the next candle closes, the newest price enters the calculation and the oldest price leaves it.
This equal weighting produces a relatively smooth line. The SMA responds more gradually to recent price changes than an EMA using the same period.
Exponential Moving Average (EMA)
The Exponential Moving Average places greater weight on recent prices while retaining information from earlier observations.
This weighting makes the EMA respond more quickly to recent market movement than an SMA with the same period. Short-term Forex traders frequently use EMAs when recent momentum forms an important part of the strategy.
Greater responsiveness also means the EMA reacts more strongly to short-term volatility. The choice between SMA and EMA therefore depends on the purpose of the analysis rather than one type being universally superior.
Reading Market Direction With Moving Averages
Price Position and MA Slope
Traders examine both the position of price relative to the Moving Average and the direction of the MA itself.
Price trading above a rising Moving Average supports a bullish trend reading. Price trading below a falling Moving Average supports a bearish trend reading.
A flat Moving Average reflects limited directional progress across the measured period. Repeated movement above and below a flat MA commonly appears during consolidation or range-bound conditions.
Price location alone provides incomplete trend information. Combining price position with MA slope, swing structure, support, and resistance produces a clearer reading of market direction.
Using a Single Moving Average
A single MA provides a simple reference for trend direction and pullbacks.
During an established uptrend, price often remains above a rising Moving Average and periodically retraces toward it. During a downtrend, price often remains below a declining MA and rallies back toward the line during temporary corrections.
These interactions give traders a framework for studying whether the existing trend remains intact.
Using Multiple Moving Averages
Multiple Moving Averages allow traders to compare shorter-term and longer-term price trends on the same chart.
A shorter-period MA reacts more quickly to current price action. A longer-period MA responds more slowly and reflects a broader section of market history.
The relationship between the two lines helps traders identify changes in momentum and trend structure.
Choosing a Moving Average Period
Shorter Moving Averages
Shorter periods such as 10, 20, or 21 respond closely to current price movement. They are commonly used for short-term trend analysis, momentum trading, and pullback strategies.
Their greater sensitivity produces more frequent interactions with price. It also produces more frequent false trend signals during choppy conditions.
Medium-Term Moving Averages
Periods around 50 are commonly used to evaluate intermediate trend structure.
A 50-period MA filters more short-term movement than a 10-period or 20-period MA while remaining more responsive than a 100-period or 200-period average.
Traders frequently combine the 50-period MA with a longer average to compare medium-term momentum with the broader trend.
Longer Moving Averages
Longer periods such as 100 and 200 smooth a much larger sample of price data.
These averages react slowly to new price movements and are commonly used to assess broader market direction. On a daily chart, the 200-period Moving Average is widely followed as a long-term technical reference.
Moving Average Signals in Forex
Price Crosses
A price crossover occurs when the market moves from one side of a Moving Average to the other.
A move from below to above a rising MA supports a bullish momentum reading. A move from above to below a declining MA supports a bearish momentum reading.
One crossover provides limited information on its own. The slope of the MA, wider trend, nearby price levels, and strength of the move provide the context needed to interpret the signal.
Moving Average Crossovers
A Moving Average crossover occurs when a shorter-period MA moves above or below a longer-period MA.
A shorter MA crossing above a longer MA reflects strengthening recent prices relative to the broader average. A shorter MA crossing below a longer MA reflects weakening recent prices.
Crossovers occur after price has already changed direction because both indicators use historical data. They are therefore trend-following signals rather than early predictions of a reversal.
Golden Cross
The Golden Cross refers to the 50-period Moving Average crossing above the 200-period Moving Average. The term is most commonly associated with daily charts and is interpreted as a longer-term bullish trend signal.
The crossover shows that the medium-term average has risen above the longer-term average. Price structure and continued trend development determine the strength of the signal after the crossover.
Death Cross
The Death Cross describes the 50-period Moving Average crossing below the 200-period Moving Average.
The formation reflects weakening medium-term prices relative to the longer-term average and is interpreted as a bearish trend signal.
Golden Crosses and Death Crosses develop after substantial price movement has already occurred, which is consistent with the lagging nature of Moving Averages.
Moving Average Trading Strategies
Trend Pullback Strategy
A pullback strategy uses a Moving Average as a reference during an established trend.
During a bullish trend, a trader monitors price retracing toward a rising MA and studies the reaction around that area. Bullish price structure around the average supports continuation of the existing trend.
During a bearish trend, rallies toward a declining Moving Average provide the equivalent reference for short setups.
The MA acts as an analytical guide rather than an exact price barrier. Market price regularly moves slightly through an average before resuming the existing trend.
Moving Average Crossover Strategy
A crossover strategy uses two averages with different periods.
A shorter MA crossing above a longer MA creates a bullish trend signal. A shorter MA crossing below the longer MA creates a bearish trend signal.
Traders commonly strengthen the setup by checking price structure, MA slope, momentum, and support or resistance rather than treating the crossover as an automatic order trigger.
Price Cross Strategy
The Price Cross strategy focuses on price moving through a selected MA.
A close above a rising average shows strengthening price relative to its recent mean. A close below a falling average shows weakening price.
Repeated crosses around a flat MA signal a market with limited trend structure. These conditions create more whipsaws and reduce the usefulness of simple crossover strategies.
Dynamic Support and Resistance
Moving Averages are also used as dynamic support and resistance references.
During an uptrend, a rising MA can mark an area where pullbacks repeatedly stabilize. During a downtrend, a declining MA can mark an area where rallies repeatedly lose momentum.
Moving Averages do not create fixed support or resistance levels. Their location changes with every new price observation, so traders evaluate the reaction around the line together with existing market structure.
Confirming Moving Average Setups
Moving Averages and RSI
Moving Averages describe trend direction, while the Relative Strength Index (RSI) measures price momentum.
A rising Moving Average combined with bullish price structure and strengthening RSI gives the trader information from both trend and momentum analysis. A weakening RSI during an established trend highlights declining momentum and provides a reason to examine the price structure more closely.
Moving Averages and Fibonacci Levels
Fibonacci retracements provide horizontal reference levels for measuring corrections within a larger price move.
A Fibonacci retracement level located near a rising or falling Moving Average creates technical confluence between a fixed retracement measurement and a dynamic trend indicator.
Price reaction around the combined area determines the usable trading signal.
Moving Averages and Volume Analysis
Volume indicators provide information about trading activity and market participation.
Spot Forex operates through a decentralized market, so traders generally work with tick volume or broker-provided volume rather than one centralized market-wide volume figure.
Changes in activity around an MA crossover, trend breakout, or pullback add another layer of information to the price signal.
Forex Moving Average Example
Using the 50-Period and 200-Period SMA on EUR/USD
Consider EUR/USD on a daily chart with the 50-period and 200-period Simple Moving Averages applied.
The 50-period SMA begins rising and crosses above the 200-period SMA. Price is also trading above both averages, while the 200-period SMA has started turning upward.
This structure presents a stronger bullish trend reading than the crossover alone because price location, medium-term momentum, and longer-term MA direction are aligned.
A trader following the trend can then monitor pullbacks toward the 50-period SMA, previous support, or another technical level. The entry comes from the price reaction around that area rather than from the Golden Cross alone.
A stop-loss level belongs beyond the price structure that invalidates the setup. The Moving Average provides context for the trade, while the actual technical structure defines risk.
Strengths of Moving Average Analysis
Clearer Trend Structure
Moving Averages reduce the visual impact of short-term fluctuations and make broader directional movement easier to recognize.
Consistent Reference Points
An MA uses a defined mathematical calculation. This gives traders a repeatable reference for comparing price across different market conditions.
Flexible Application
Moving Averages work with different chart periods, instruments, and trading styles. The chosen MA period changes the sensitivity of the indicator to current price action.
Useful for Trend-Following Systems
Moving Averages naturally fit trend-following strategies because their calculations update as price develops.
Their lag becomes part of the strategy: the trader waits for evidence of a trend rather than attempting to identify the exact turning point in advance.
Limitations of Moving Averages
Moving Averages Lag Price
Every Moving Average is calculated from historical data. The indicator therefore responds after the underlying price has already moved.
Shorter periods reduce the amount of lag and increase sensitivity. Longer periods create smoother signals and respond more slowly.
Sideways Markets Produce Whipsaws
Moving Average strategies lose clarity when price moves sideways.
Price repeatedly crossing above and below the same average can generate several opposing signals without producing a sustained trend. Crossovers between two MAs behave similarly during choppy conditions.
No Single Period Fits Every Strategy
A 20-period MA measures a different section of price history from a 50-period or 200-period MA.
Period selection should match the timeframe, expected trade duration, and type of trend being analyzed.
Moving Averages Do Not Measure Everything
A Moving Average summarizes price over time. It does not directly measure fundamental conditions, economic events, order flow, or the reasons behind a market move.
This is why MA analysis works more effectively as one part of a wider trading framework.
Risk Management With Moving Average Strategies
Use Price Structure for Stop Placement
A Moving Average provides trend information rather than a guaranteed support or resistance level.
Stop-loss placement should reflect the price level that invalidates the actual trade setup. Swing highs, swing lows, support, resistance, and volatility provide stronger risk references than placing a stop a fixed distance from an MA.
Adjust Position Size to the Stop
The technical setup determines the stop location. The distance between the entry and stop then determines the appropriate position size for the trader's chosen monetary risk.
This keeps risk controlled without moving the stop into an unsuitable location simply to accommodate a larger position.
Recognize Changing Market Conditions
A Moving Average strategy designed for trending conditions produces different results once the market enters consolidation.
Flattening MAs, frequent crossovers, and repeated price movement through the same average show that trend strength has weakened. Traders can respond by reassessing the setup rather than forcing a trend-following signal into a range.
Common Moving Average Mistakes
Treating Every Crossover as a Trade
Crossovers describe a change in the relationship between two historical averages. They do not provide complete information about market structure, risk, or the quality of the entry.
Treating an MA as Exact Support or Resistance
Price regularly trades through a Moving Average before continuing in the existing direction. The line is better treated as a dynamic reference area within the wider chart structure.
Changing MA Periods After Every Losing Trade
Constantly changing indicator settings removes consistency from the strategy.
MA periods should reflect the market horizon being analyzed rather than being adjusted solely to fit recent price history.
Ignoring the Slope of the Average
Price above a sharply falling MA carries different information from price above a clearly rising MA.
The direction of the Moving Average forms an important part of trend interpretation.
Using Too Many Moving Averages
Adding several averages with similar periods can duplicate the same information and make the chart harder to interpret.
Each Moving Average should serve a defined analytical purpose.
Conclusion on Moving Averages in Forex
Building a Structured MA Approach
Moving Averages organize historical price data into a smoother trend line. The SMA gives equal weight to observations within its period, while the EMA gives greater weight to recent prices and responds more quickly.
Traders use Moving Averages to study trend direction, price pullbacks, crossovers, momentum changes, and dynamic support or resistance behavior. Their strongest role is trend analysis rather than prediction.
A structured approach combines the MA with price action, market structure, momentum, and defined risk. The Moving Average then serves its proper purpose: providing a consistent view of how current price relates to its recent and longer-term history.
FAQs
What Is a Moving Average in Forex Trading?
A Moving Average is a technical indicator that calculates an average of price data across a selected number of periods. The resulting line smooths short-term fluctuations and helps traders analyze trend direction.
What Is the Difference Between SMA and EMA?
An SMA gives equal weight to all observations within the selected period. An EMA gives greater weight to recent price data, which makes it respond more quickly to current market movement.
Which Moving Average Is Better for Forex?
SMA and EMA serve different analytical purposes. An EMA provides greater sensitivity to recent price movement, while an SMA creates a smoother representation of the selected period. The appropriate choice depends on the strategy and timeframe.
What Is a Moving Average Crossover?
A Moving Average crossover occurs when one MA moves above or below another. Traders commonly compare a shorter-period MA with a longer-period MA to study changes in trend momentum.
What Is a Golden Cross?
A Golden Cross occurs when the 50-period Moving Average crosses above the 200-period Moving Average. On a daily chart, it is widely used as a longer-term bullish trend signal.
What Is a Death Cross?
A Death Cross occurs when the 50-period Moving Average crosses below the 200-period Moving Average. On a daily chart, it is interpreted as a longer-term bearish trend signal.
Are Moving Averages Leading or Lagging Indicators?
Moving Averages are lagging indicators because their calculations use historical price data. The indicator changes after new price information enters the calculation.
Why Do Moving Average Strategies Produce False Signals?
False signals become more frequent during sideways and choppy markets. Price repeatedly crosses the Moving Average without developing a sustained directional trend, producing whipsaws.
Can Moving Averages Be Combined With Other Indicators?
Moving Averages work well alongside momentum, price structure, Fibonacci levels, and volume analysis. Each tool adds a different type of market information rather than repeating the same signal.
What Moving Average Period Should Forex Traders Use?
The period should match the trading horizon. Shorter averages track recent price changes more closely, while longer averages provide a smoother view of broader trend direction.
Published by:
 Daniel Carter